Series Voltage Generator
Aim
To simulate a transistor sweep generator circuit.
Components
|
Name
|
EDWin Components Used |
Description |
Number of components
required |
| TRANSISTOR |
BC107A |
Transistor |
1 |
| RES |
RC05 |
Resistor |
2 |
| ZENER |
1N3016A |
Zener |
1 |
| VDC |
VDC |
Dc voltage source |
1 |
| GND |
SPL0 |
Ground |
1 |
Theory
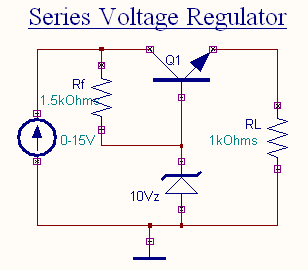
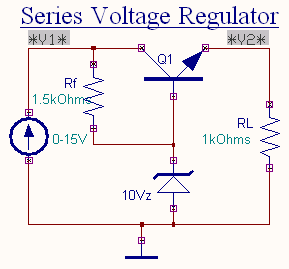
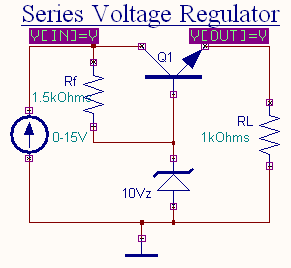
A simple Series Voltage Regulator is shown.
The transistor Q1 is the series element, which controls
the amount of input voltage that gets to the output. The zener diode provides the
reference voltage. The regulating operation can be described as:
- If the output voltage decrease the increased
base-emitter voltage causes the transistor Q1 to conduct more, there
by raising the output voltage. I.e. maintaining the output constant.
- If the output voltage increases, the decreased base-emitter voltage causes transistor Q1
to conduct less, there by reducing the output. I.e. maintaining the output constant.
The output voltage is given by

where Vo is the output voltage
VZ is the zener brake down voltage.
Procedure
EDWinXP -> Schematic Editor: The circuit
diagram is drawn by loading components from the library. Wiring and proper
net assignment has been made. The resistor R is assigned
a proper value.
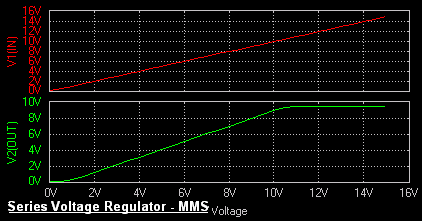
EDWinXP-> Mixed Mode Simulator: The circuit is preprocessed. The output may be
obtained by performing DC Sweep Analysis. The waveform markers are placed at the input and output. The
sweep parameter (voltage) for input source is set in the Analysis window.
The applied voltage is swept from an initial value of 0 to final
value of 15V in steps of 0.5V. The output is plotted against varying input. The waveforms
are observed in the Waveform Viewer.
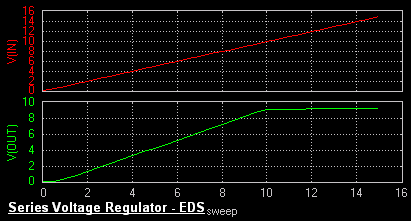
EDWinXP -> EDSpice Simulator: The circuit is preprocessed. The output may be
obtained by performing DC Transfer Function Analysis. The waveform markers are placed at the input and
output. The sweep parameter (voltage) for input source is set in the
Analysis window. The applied voltage is swept from an initial value of 0 to
final value of 15V in steps of 0.5V. The output is plotted against varying input. The
waveforms are observed in the Waveform Viewer.
Result
The output waveform may be observed in the waveform viewer.
