Working with Waveform Viewer

Invoke Waveform Viewer either from the analysis mode or right click System in Project Explorer and select Waveform Viewer from the list.
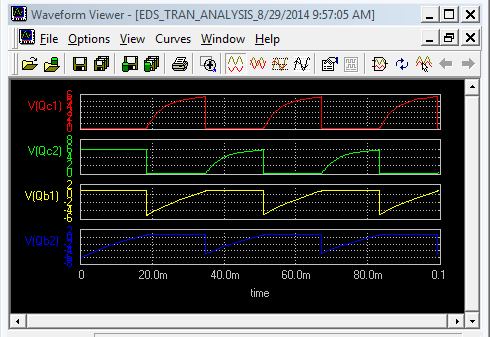
1. We will now load the previously created example, numeric data file TUTOR_EX.MCR. Load the tutor_ex.mcr using the File | Open command. The TUTOR_EX.MCR data file is opened, and the diagram data is loaded to the Waveform Viewer data buffers.
2. We will have to choose the parameters to be displayed. For this, select Option/ Waveform from the menu. Select Add/ Edit Curves tab. In the Select Curve drop down 4 variables (Frequency, Magnitude, Phase Shift and Group Delay) had been loaded. These were four parameters that the analog simulation had generated. Four buffers are reserved to store numeric values loaded. Click the CLOSE button.
3. We will observe that the frequencies are displayed in the logarithmic scale. This is because their subsequent values coming from the input file were arranged in the exponential series and the Waveform Viewer automatically assigns the logarithmic axis scaling as the best possibility. ed for frequenci4. The diagram scale in X-direction is logarithmic but the diagram frame raster is built with lines placed for frequencies 10 Hz, 100 Hz, etc. only. To fill the frame with full logarithmic raster, select Options | Waveform from the menu. We will get a dialog box as shown below. Select Axes tab.
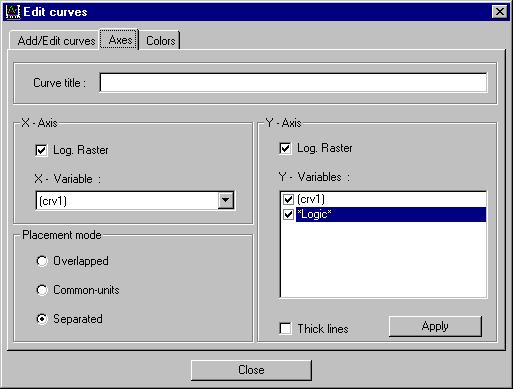
5. Enable Log. Raster check box in the X-axis group frame. Redraw the diagram by clicking on the APPLY button.
6. We can enter a title in the Curve title edit box: AC SIMULATION RESULTS. We can then draw all the variables in separated graphs by choosing Separated Placement Mode then to redraw the diagram, press the APPLY button.
7. We may examine the drawing of graphs by checking the Thick Lines check box then redrawing the diagram. Disable the Thick Lines check box then redraw the diagram.
8. To display different set of variables, check against the required variables in the list box. Select another set of variables to draw, then click the APPLY button. he diagram and o9. We may also define colors to the graphs using the Colors tab. Select the curve from the list and choose the required colors from the drop down Select Colors.
10. Move the cursor over the diagram and observe the Values in the status bar at the bottom of the window. Test values are displayed concurrently as we move mouse over the graph. m the list of var11. The Waveform Viewer provides lot of useful features to study effects on any particular variable and its representation. Let us take the Magnitude variable. Select this variable by invoking the menu Option/ Waveform/ Axes tab. From the list of variables choose Magnitude as only one variable to draw and then click APPLY button.
12. We may create and display new variables from the existing ones using arithmetic expressions. Assume that we want to see the amplifier Magnitude curve in the linear units (not dB). Since the gain in decibels were calculated using the formula: Edit Curves tab. Select the option Add Curve. For the system prompt, type in the new Variable Name text. Amplification. Type in the Expression formula: 10 ^ (Magnitude / 20). Type in the Variable Units (enclosed in the brackets) text. [V/V]. Click the RECALC button and click APPLY to view the changed diagram.
The diagram may be saved to the project from File/ Save to Project menu item. We may copy the diagram picture as a Windows bitmap into the Windows Clipboard at any time. Invoke the Windows Clipboard application to see what has been copied into the Clipboard, or invoke any application that can paste bitmap information from the clipboard (e.g. Windows Paintbrush, Write) to test. Probably we will need to adjust the diagram background color and other diagram item colors before copying it to the clipboard.