Analyze the electromagnetic field effects on the board
Right click on the task PCB LAYOUT in the Project Explorer to unfold a list of functions. Clicking on Electromagnetic Analyzer in this list opens up this module.
1. From the drop down list of the File menu of Project Explorer, select Open Project and select a project. Load the project COUNTER.EPB from \Job directory.
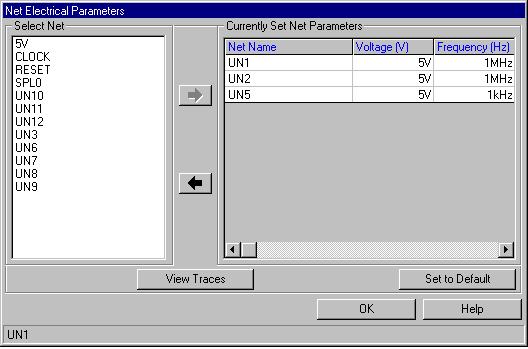
2. Now set up the electrical parameters for the nets. Right click and
select the tool  Electrical
Parameters to include the nets for analysis. A window pops up. Click on the net UN1
from the list and select it to set the parameters. All the nets in the loaded
project is displayed here. The right side of the window will now display the
electrical parameters for the selected net. Enter the voltage and frequency
value for the net.
Electrical
Parameters to include the nets for analysis. A window pops up. Click on the net UN1
from the list and select it to set the parameters. All the nets in the loaded
project is displayed here. The right side of the window will now display the
electrical parameters for the selected net. Enter the voltage and frequency
value for the net.
3. Repeat the same procedure for the other two nets UN2 and UN5 and include these two nets also for analysis. Enter the voltage and frequency value for each net and add to the list.
For example:
UN1 - 5V, 1MHz
UN2 - 5V, 1MHz
UN5 - 5V, 1KHz
4. If you select the SET TO DEFAULT button, the default parameter gets loaded into the text boxes.
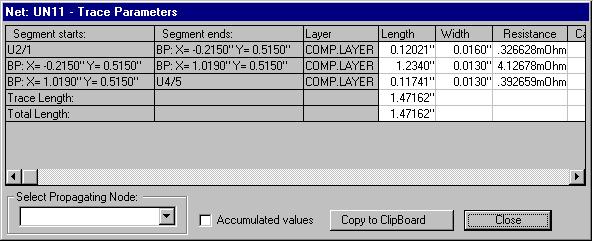
5. View the electrical parameters of the trace from point to point using
the
 button.
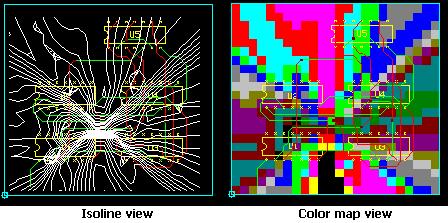
6. After adding these nets you may execute the analysis directly. For this
right click and select the tool  Execute Analysis. The result is displayed in the form of isolines. Color
mapping on the board and may be viewed by switching on the option Colored board
under View/ Analysis Results menu.
Execute Analysis. The result is displayed in the form of isolines. Color
mapping on the board and may be viewed by switching on the option Colored board
under View/ Analysis Results menu.
7. The analysis result is as shown: The Maximum and minimum field intensity locations are shown here.
8. Labels may be placed to display the field intensity at various points on the board. For this select the tool  Set/ Delete Isolines and click on the board at required locations. Label gets tagged to the cursor. Now drag the mouse to place the label at proper place.
Note: To delete the isoline field label click again on the label.
The use of other tools in this module is explained in online help and User’s guide.