Distortion Analysis
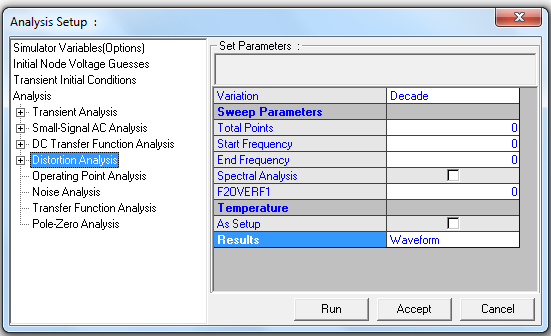
Opens a window to set parameters for Distortion analysis.
Any deviation of an output signal from its corresponding input is a distortion of the input signal. Some examples of signal distortions are Crossover distortion, Failure-to-follow distortion, Frequency distortion, Phase distortion etc. These can all be viewed and studied by running an appropriate AC small signal analysis.
However, Harmonic distortion and Intermodulation distortion can be studied in SPICE only by running a Distortion analysis. Harmonic Distortion is the change in a signal at the output, compared to the input, due to the frequency components that get introduced into the output as a result of part non-linearity. The additional frequencies are integer multiples of the input frequency.
In order to run Distortion analysis, specify the analysis parameters by selecting Analysis/ Distortion analysis from the tree view. Specify the simulation parameters such as start frequency, end frequency, total points etc. If you have two signals at the input, and want to study the Intermodulation distortion, specify the value of F2OVERF1 and select the check box. If ‘As Setup’ is checked, the analysis is performed at the temperature set from the menu Setup/ Temperatures. If this option is not checked, the operating temperature is taken as 27° C. Select the type of presenting results from ‘Results’ dropdown and set the parameters as per the selection made for Waveform Viewer, Print (Standard Output), Plot (Standard Output) and Fourier (Setup). Click ACCEPT button to accept these values and on RUN button to execute the analysis. In case you specified PRINT or PLOT results you may view it by selecting "File -> View EDSpice Files -> Standard Output".